Finally! The new “Demographic Ranks” is live today. We know. It took for…ever. But, all I can say is it was just really quite hard. Yes, the entire endeavor consists of exactly one single page. But, it is a fairly useful and maybe even, to those who are being somewhat generous, a pretty cool page. Of course, it is almost certainly not half as cool as you were hoping it would be, nor is it even one tenth as cool as we really wanted it to be. It also took 10 times as long to build as we projected. All of this, as those familiar with the industry will be quick to point out, is just a rather long-winded way of explaining that this was a software development project.
So, now that we effectively dispatched any expectations you might have, let’s move on to the good stuff.
So what’s this demographic all up in my rank?
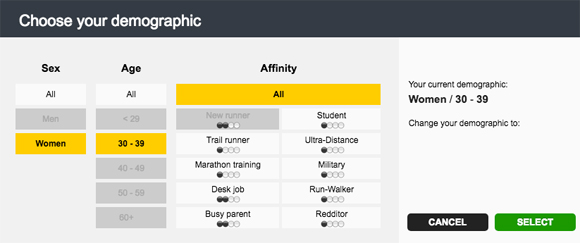
A demographic is made up of three components: sex, age, and affinity.

For example, a demographic could be: “Women / 20 – 29 / Marathon Training”. Or it could also be any combination of those. Such as, “Women / Marathon Training”, or even just anyone Marathon Training or anyone 20 – 29, it could also be just anyone at all. The point is that you get to choose who you want to compare yourself to, and you can make that group as broad or narrow as you want.
When we first announced that we were dividing the ranks by demographics, we asked for runners to submit their own affinity groups, or to join the groups others had submitted. This effort produced hundreds of suggestions, but many had only just a few members. We took all of these and culled them down to the 10 most popular. In the future, as more people join Smashrun, we’ll add new narrower affinity groups and maybe, one day, you’ll be able to join Women / 60+ / Barefoot, Finnish, Vegan Runners. But for now, we just have the following: Trail Runners, Marathon Training, Desk Job, Redditor, Run-walker, Military, Student, Busy Parent, New runner, and Ultra-distance.
198 demographics to start
10 affinities X 5 age brackets X 2 sexes = 100 demographics. However, since “All/Any” is also an option, that works out to 198 unique demographics. Some of these ended up being pretty thin, for example: “Men / 60+ / Students,” so we set a threshold of 50 members for any given demographic to go live. In practice, the way this works is that you first join a demographic that’s available, and afterwards choose a demographic that isn’t yet available, but that you would like to join if it was. You’ll be put in a waiting list, and when enough people join, the new demographic goes live and everyone who chose it gets moved automatically from their existing demographic to the new one.
How does it work?
Every day we add up how far, how often and how fast everyone in each demographic ran. Then we use that information to create a brand new curve. Just like when you were in school, this curve creates a percentile rank and that rank contributes to your Overall Score.

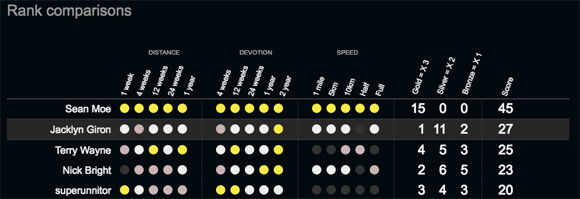
Each gold medal is worth 3, silver is 2, bronze is 1. So if, like in the example above, you have 1 gold medal (1×3), 11 silver medals (11×2), and 2 bronze medals (2×1), then your Rank Score would be 27. The nice thing about the score is that it’s relative to each individual’s demographic. So, you’re not “competing” with the people you follow. The score is the tally of how everyone is doing within their categories. It’s like the equivalent of an age-graded time or your gender place for a race that you ran.
The other nice (maybe, challenging?) thing about Demographic Ranks is how often the curves change. Every new run logged within your demographic affects that demographic’s curve.
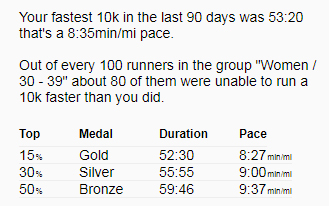
If, for example, you ran 10 kilometers this week, we might calculate that 49% of the people in your demographic “New runners / 60+” ran less than that, and 51% ran more – i.e. your distance was just a bit better than average. So you’ve got a bronze medal! Sweet! But let’s say tomorrow is the last Sunday of the month, and all of the runners in your group go out for long runs because they want to hit their monthly goals. Suddenly, your 10 kilometers isn’t so great anymore, the average 7-day distance jumped up to 12 kilometers and, because of that, now just 40% of your peers ran less than you. Your rank goes down and you’ve lost your medal.
Your rank is a moving target. If you want to stay on top of them, you’ve got to do better than your peers did each and every day. Luckily, you’ll know exactly how to move up within the ranks…

You can also view the gold/silver/bronze thresholds by mousing over the “Details” which, for the above, looks like this…

Picking your demographic
When you choose your demographic the only thing you should consider is this: Do you think these people might be pretty similar to you? What you don’t want to do is choose a demographic based on how high your rank is. One reason for this is that if everyone did this, then all the ranks would average out and end up being pretty similar. But, more importantly, when you choose people like you, then it’s possible that they have similar running patterns to you. Busy parents might not have time to run on public holidays, and students might be too busy to run during exam season. That means when it’s hard for you it’s also hard for everyone else, so the ranks will be easier to stay on top of.
What’s next?
The obvious thing missing from the new ranks page is a way for you to learn about the other people in your demographic. Who are they? Who runs as far, as fast, and as often as you do? And who’s the best? Who are the leaders? This is all coming soon.

The new demographics is an Impressive piece of work by your team. Well done!
Can you check how the year selection is populated when it requires you to enter your birthday? It only lists years 1977 – 1969 (no matter what age group I select). I entered bug report on this as well, fyi.
Got around this by going into my personal info page and entering birthday there.
Thanks Jim! We’ll patch it tonight 🙂
Where in the interface do I choose my demographic?
Top right corner of the ranks page. The link that says “Change demographic”
I think we’ll add a guider to prompt people to set it. It’s not super intuitive right now.
Go it. Thanks, Chris!
You guys rock! Just got my International badge this week…love what you guys are doing…keep it up.
PDX runner
Im liking the updated demographics.
A couple of things, if I change the demographics I lose the graph and cant seem to get it back no matter what I do to the demographic options.
How can I tell whats changed? i.e. gone from a silver to a gold, silver to a bronze etc?
Keep up the good work 🙂
The easiest thing is to look at your score – the far right value in the rank comparison table. It’s 3 points for a gold, 2 for a silver and 1 for a bronze. It wasn’t possible to retroactively calculate the medals historically, so when you change your rank the graph disappears and gets rebuilt over time.
We’re still learning about how this will work in practice, but I think it’s best to not to choose a demographic by your score. The curves will likely shift quite a bit this first week as people make their choices. The interesting thing is that your choice affects everyone else as well. If a sprinter joins run/walkers than it’ll be that much harder for everyone in the demographic to get gold.
Now that is way cool, and I like I can see how I rank compared to my friends too … really interesting, if a little depressing at time 🙂
Nice work team!
I love what you’ve done. Good work guys!
I like the new features a great deal. One thing, unless I’ve missed something, that would be interesting would be to be able to modify (extend) the time period covered by the ‘score history’ graph. At present, it seems to be fixed at ‘the last 7 weeks’.
Well done! Thanks for the good work!
I love this! Thanks for implementing.
It’s very nicely designed, and it’s nice to have more realistic stats – i.e., no longer to be compared to people much younger or older or from the opposite sex.
Great post! Your writing style is cool and easy to understand.