We’re introducing two new features that we think will help you see your running in a whole new light and, perhaps, motivate you to keep improving. Of course, since that’s pretty much our raison d’être, it’s safe to say we’re super excited!
The trailing miles chart
This new chart replaces the cumulative miles chart and it’s calculated in three different ways depending on the calendar view you’ve selected. As you drill down through each view — from all time, to a single year, and then a specific month, the framing of the chart will change from trailing 365 to 90 and then to 7 days. Each view is meant to provide insight into your training that might otherwise be difficult to spot at a different scale.
There are a few interesting artifacts of trailing time frame charts. For example, you might be running a lot right now, but your graph could still be plummeting. This is because looking at the direction of the chart doesn’t answer how much you’re running right now, it only answers the question Did you run more miles today than you did 365/90/7 days ago from today? If you did then the last point in your chart will be going up, otherwise, no matter how many miles you logged today your chart will still go down.
So why is it useful to look at your cumulative miles in this fashion? As it happens, there are entirely different changes that occur to a runner’s physiology over different training periods. By viewing your cumulative miles over each of these periods you can gain different insights into the state of your running.
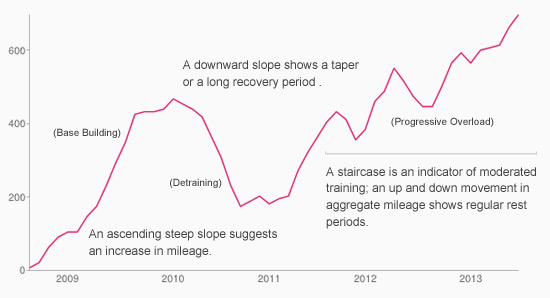
Fully zoomed out. This is the 10,000 foot view of your running. Let’s call it the grand arc of your running. This view provides you with the great (or, in my case, rather modest) story of your running. Smashrun can handle up to a decade of running data, so the scope of this chart can be pretty huge.
This chart washes out the day-to-day, or even week-to-week bumps in your training, and lets you focus on the big picture. In addition, your total mileage on this chart is a really good indicator of the long term structural adjustments your body made in response to that training.
The classic changes to body composition that occur for runners (leaning of your legs and arms, flattening and toning of your midriff, hips and chest) happen slowly over a long time period and they also unwind slowly when you stop training. Because of this, it’s almost certainly true that at the apex of your trailing 365 day chart you looked, to the casual observer, more like a runner than at any other point in time.
This chart is actually a pretty good proxy for your body’s changes in response to your running but, in addition to body composition, other changes happen in this kind of time frame. Your body’s ability to handle training load, your running form, and your runner’s IQ, all gradually improve and are slow to diminish.
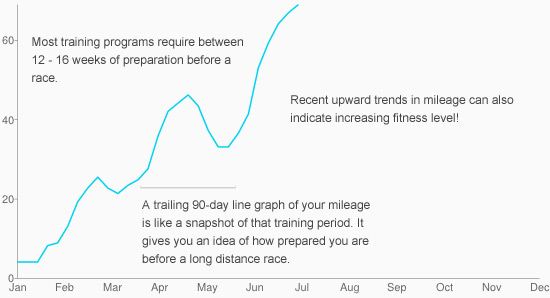
The vast majority of your aerobic conditioning comes from just the past 90 days of your training. Go without any exercise at all for 90 days and, regardless of what condition you were in before, you’re going to be struggling that first day out. Whether you’re training for a race or just want to maximize your performance, the trailing 90 day view is what you’ll want to look at.
That said, it is of course also true that raw miles are only part of the story. How you train matters at least as much, but we’ll have to save that analysis for the future.
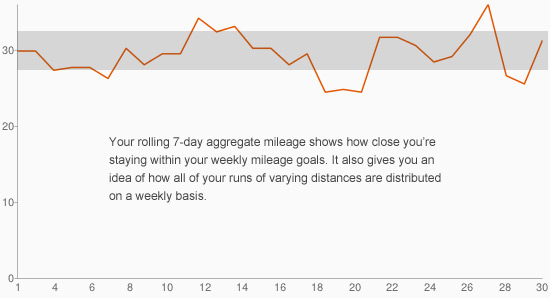
This is pretty much the only view that you can actually manage day-to-day. You’ve set your targets. You know how many miles you want to hit each week. This view is the one you want to look at to see if you’re on target. Think of it like weekly goals, for every day of the week.
Speaking of weekly stats…that brings me to feature number two of this release.
The weekly email report
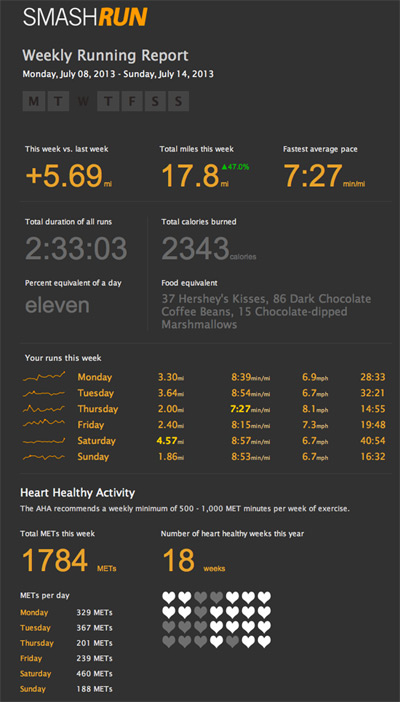
The weekly report email is designed to help you hit your weekly miles and motivate you to get back at it when you fall behind. We’re motivated by food, so we baked that into the report. Here’s what it looks like.
A few things to note:
- If you don’t run for a given week, you’ll instead get The Weekly Non-Running Report that provides all sorts of interesting stats about your non-running.
- The run list highlights your fastest and longest runs that week
- You can choose the flavor of your food equivalent from Vegetarian to Bacon and everything in between (Chocolate, Seafood, BBQ, Booze, or Dessert)
What are METs?
When you’re at rest. Totally at rest. On your back. Eyes closed. Dead still. Your body is at 1 MET per minute. Stand up you jump to 2. Have a walk around you’re at three. Start running and you can be at anything between 5 to 15 METs/minute. Run for 20 minutes at a 5 MET pace. You’ve just earned 100 METs. Why do you care?
Well, virtually all health and fitness-related research is measured against METS. And virtually every positive health effect of fitness increases as you increase your METs per week. Want to reduce you chance of cancer, heart disease, psoriasis you name it, up your METs.
For heart disease, what matters is consistency. The American Heart association recommends that you exercise for 500-1000 MET minutes every week to dramatically reduce your heart disease risk. The weekly running report will track that for you and let you know how often you hit that goal, which is really pretty cool, because heart disease is the #1 cause of death. Number 2 is cancer and increasing your METs can reduce your chances of developing many of the most common types of cancer as well.
So there you have it. Run. Use Smashrun. Run more. Keep on living to run another day.
Cool new Chart but not easy to understand :p …
it is a sum of kilometers during 7, 90, 365 rolling days ?
Exactly. That’s a much more succinct way to put it.
Keep up the great work guys. I love the trailing 365 days chart. I was maintaining a personal one on a monthly basis using a google spreadsheet. Now Smashrun is doing it for me! Well done!
I love the report. Is it possible to include a way of posting the weekly report to Facebook? Great work all! Thanks.